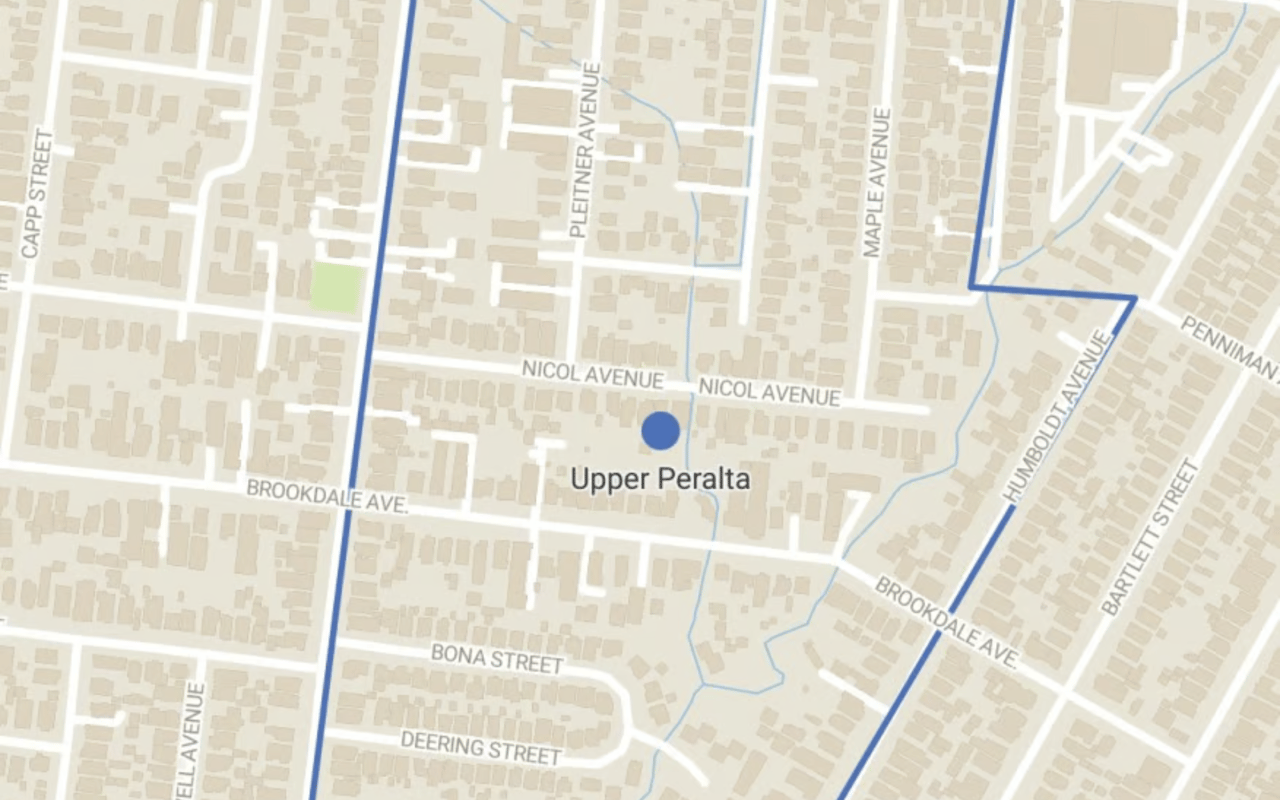
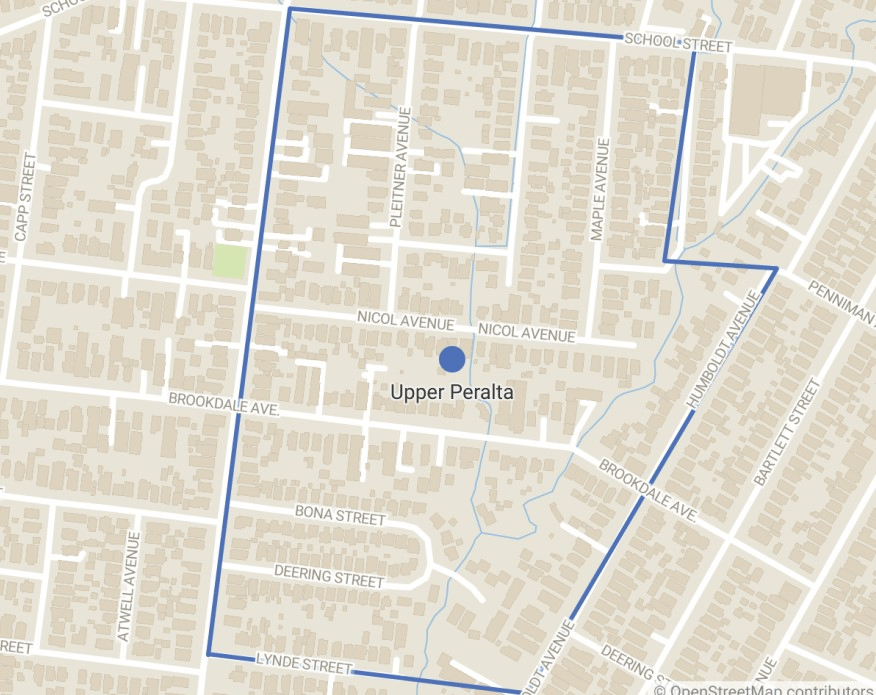
Upper Peralta
Featuring Victorian-era homes, Craftsman bungalows, and easy access to downtown.
Featuring Victorian-era homes, Craftsman bungalows, and easy access to downtown.
2,517 people live in Upper Peralta, where the median age is 36 and the average individual income is $35,965. Data provided by the U.S. Census Bureau.
Total Population
Median Age
Population Density Population Density This is the number of people per square mile in a neighborhood.
Average individual Income
There's plenty to do around Upper Peralta, including shopping, dining, nightlife, parks, and more. Data provided by Walk Score and Yelp.
Explore popular things to do in the area, including Guava the Caribbean Food Company, Tony Franco Tennis, and Super Scholars.
| Name | Category | Distance | Reviews |
Ratings by
Yelp
|
|---|---|---|---|---|
| Dining · $ | 3.37 miles | 5 reviews | 5/5 stars | |
| Active | 0.94 miles | 6 reviews | 5/5 stars | |
| Active | 2.52 miles | 5 reviews | 5/5 stars | |
| Active | 0.45 miles | 6 reviews | 5/5 stars | |
| Active | 1.39 miles | 8 reviews | 5/5 stars | |
| Active | 1.79 miles | 37 reviews | 5/5 stars | |
| Active | 3.25 miles | 9 reviews | 5/5 stars | |
| Beauty | 2.31 miles | 24 reviews | 5/5 stars | |
| Beauty | 3.25 miles | 128 reviews | 5/5 stars | |
| Beauty | 2.46 miles | 6 reviews | 5/5 stars | |
| Beauty | 1.99 miles | 6 reviews | 5/5 stars | |
| Beauty | 3.25 miles | 24 reviews | 5/5 stars | |
|
|
||||
|
|
||||
|
|
||||
|
|
||||
|
|
||||
|
|
Upper Peralta has 895 households, with an average household size of 3. Data provided by the U.S. Census Bureau. Here’s what the people living in Upper Peralta do for work — and how long it takes them to get there. Data provided by the U.S. Census Bureau. 2,517 people call Upper Peralta home. The population density is 33,785.888 and the largest age group is Data provided by the U.S. Census Bureau.
Total Population
Population Density Population Density This is the number of people per square mile in a neighborhood.
Median Age
Men vs Women
Population by Age Group
0-9 Years
10-17 Years
18-24 Years
25-64 Years
65-74 Years
75+ Years
Education Level
Total Households
Average Household Size
Average individual Income
Households with Children
With Children:
Without Children:
Marital Status
Blue vs White Collar Workers
Blue Collar:
White Collar:
Get assistance in determining current property value, crafting a competitive offer, writing and negotiating a contract, and much more. Contact me today.


