East Bay housing market comparison graphic with a waterfront city aerial and year-over-year single-family home comparison.

What’s Up with the East Bay Housing Market?

Sharon Alva August 26, 2025

East Bay housing market comparison tile over an aerial view of waterfront homes.
 
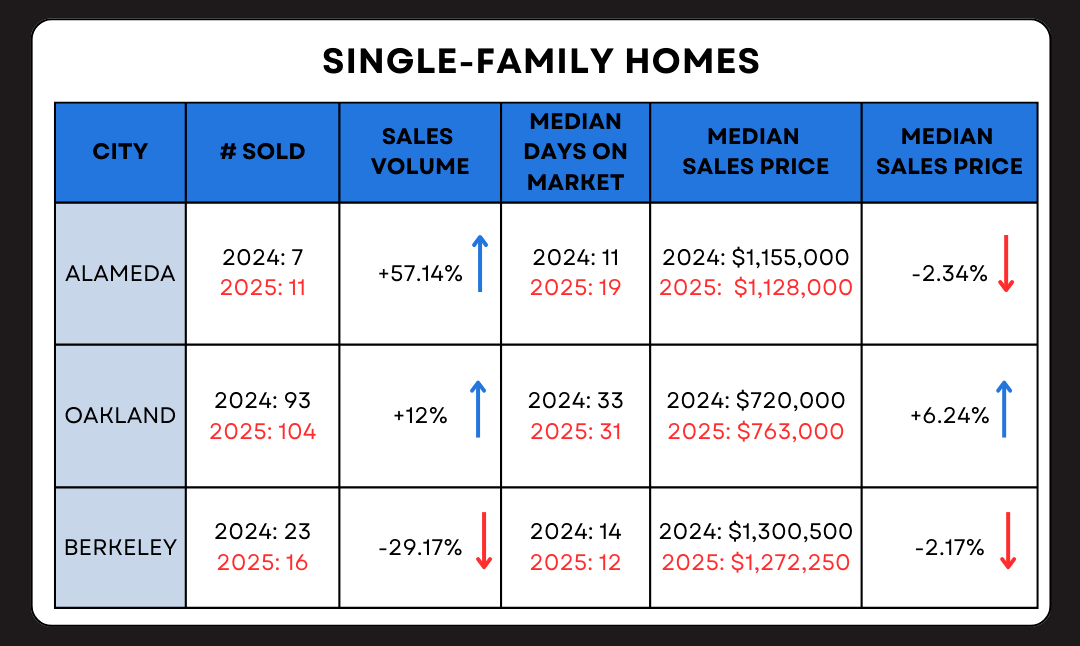
Single-family home market chart comparing sales, days on market, and prices in Alameda, Oakland, and Berreley.
 
January Year-Over-Year Comparison: Looking at year-over-year sold pricing is a glance in the rearview mirror. Houses that closed in January went into contract in November and December. The elections added a level of uncertainty, and prices took a dip. Many pending homes in January received multiple offers. I expect to see a rise in pricing across the various cities of the East Bay and across all property types when we crunch February numbers.
 
If you have any questions or want to talk about how this could affect your home buying or selling, just give me a call (415) 572-8759 #EastBayDigs #EastBayRealEstate #Compass #MarketUpdate

Your Real Estate Partner

Get assistance in determining current property value, crafting a competitive offer, writing and negotiating a contract, and much more. Contact me today.